Kyushu Institute of Technology Nakakuki lab

Address
Kyushu Institute of Technology 680-4 Kawazu, Iizuka, Fukuoka, Japan
The function of the molecular governor arises from flux regulation through a permeable membrane. Therefore, the membrane is a key element in our system, and a membrane design with an appropriate transmission rate has to be established. In this section, we summarize how to design a membrane with a desired transmission rate. Finally, we show simulation results to validate the design method. As you know, it is not a trivial task to make an appropriate permeable membrane for nano-scale molecules. Rather, it is a challenging task, which is why we attempted it in BIOMOD2014.
A technical highlight of our product is an integral controller for regulating the concentration of a specific DNA strand as an output signal to a desired level using a series of DNA strand displacement reactions in combination with a permeable membrane (Fig. 1). In what follows, we explain a design method for a permeable membrane that a DNA strand can pass through with a desired transmission rate.
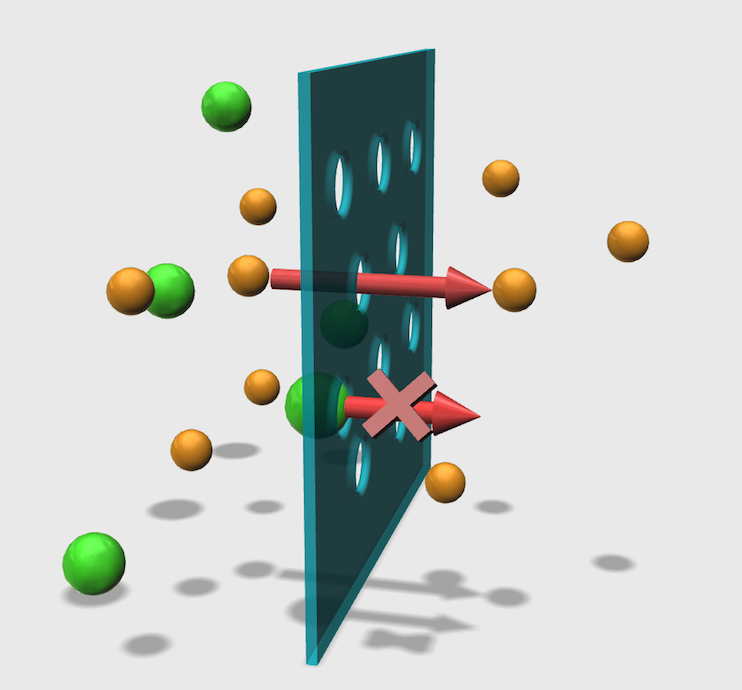
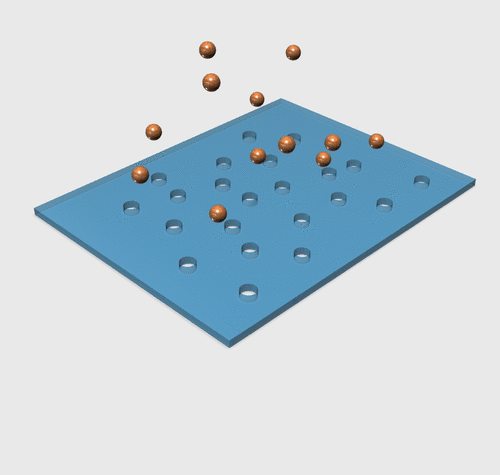
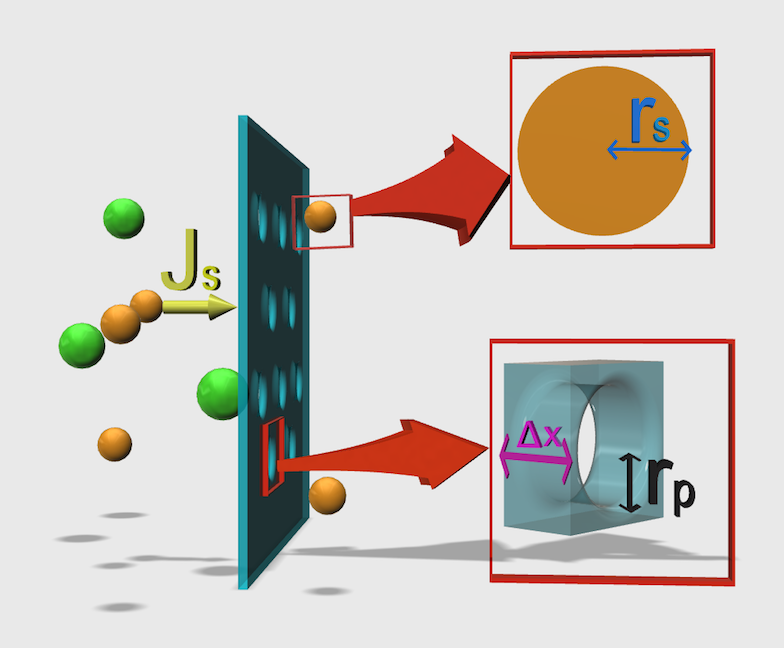
Fig. 2 illustrates the flow of a single-stranded DNA and double-stranded DNA molecule through a membrane. The single-stranded DNA can permeate the membrane because it is smaller than the pore, whereas the double-stranded DNA, which is bigger than the pore, cannot permeate the membrane. Although the ability of a molecule to pass through the membrane is simply decided by the size of the pore, we have to establish the design theory for realizing a desired transmission rate, which is a challenging task.
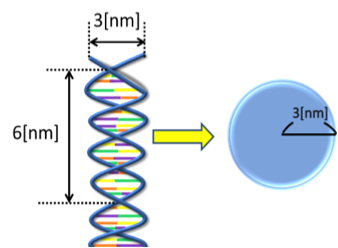
First, we consider the size of a DNA strand as a solute that permeates the membrane. For the sake of simplicity, we suppose that the shape of a DNA strand is ball-like (Fig. 3). The assumption would be valid if we estimate a larger size for the ball. For example, a 3-nm in diameter would be a reasonable choice for a short-stranded DNA. If another value is chosen for the diameter, that value is used in the following calculation.
We employed a general model called “pore mode” to derive our design theory. In this model, the solute is considered to be a hard ball, and a pore is a route in the membrane cylinder (Fig. 4). All parameters are summarized in Table 1.
To make a membrane with a desired transmission rate [1/s], we need the structural specifications such as the pore size [nm], membrane thickness [nm], and open area ratio [-]. However, the relationship between the macroscopic rate and the microscopic parameters is generally unclear. We propose a solution as follows:
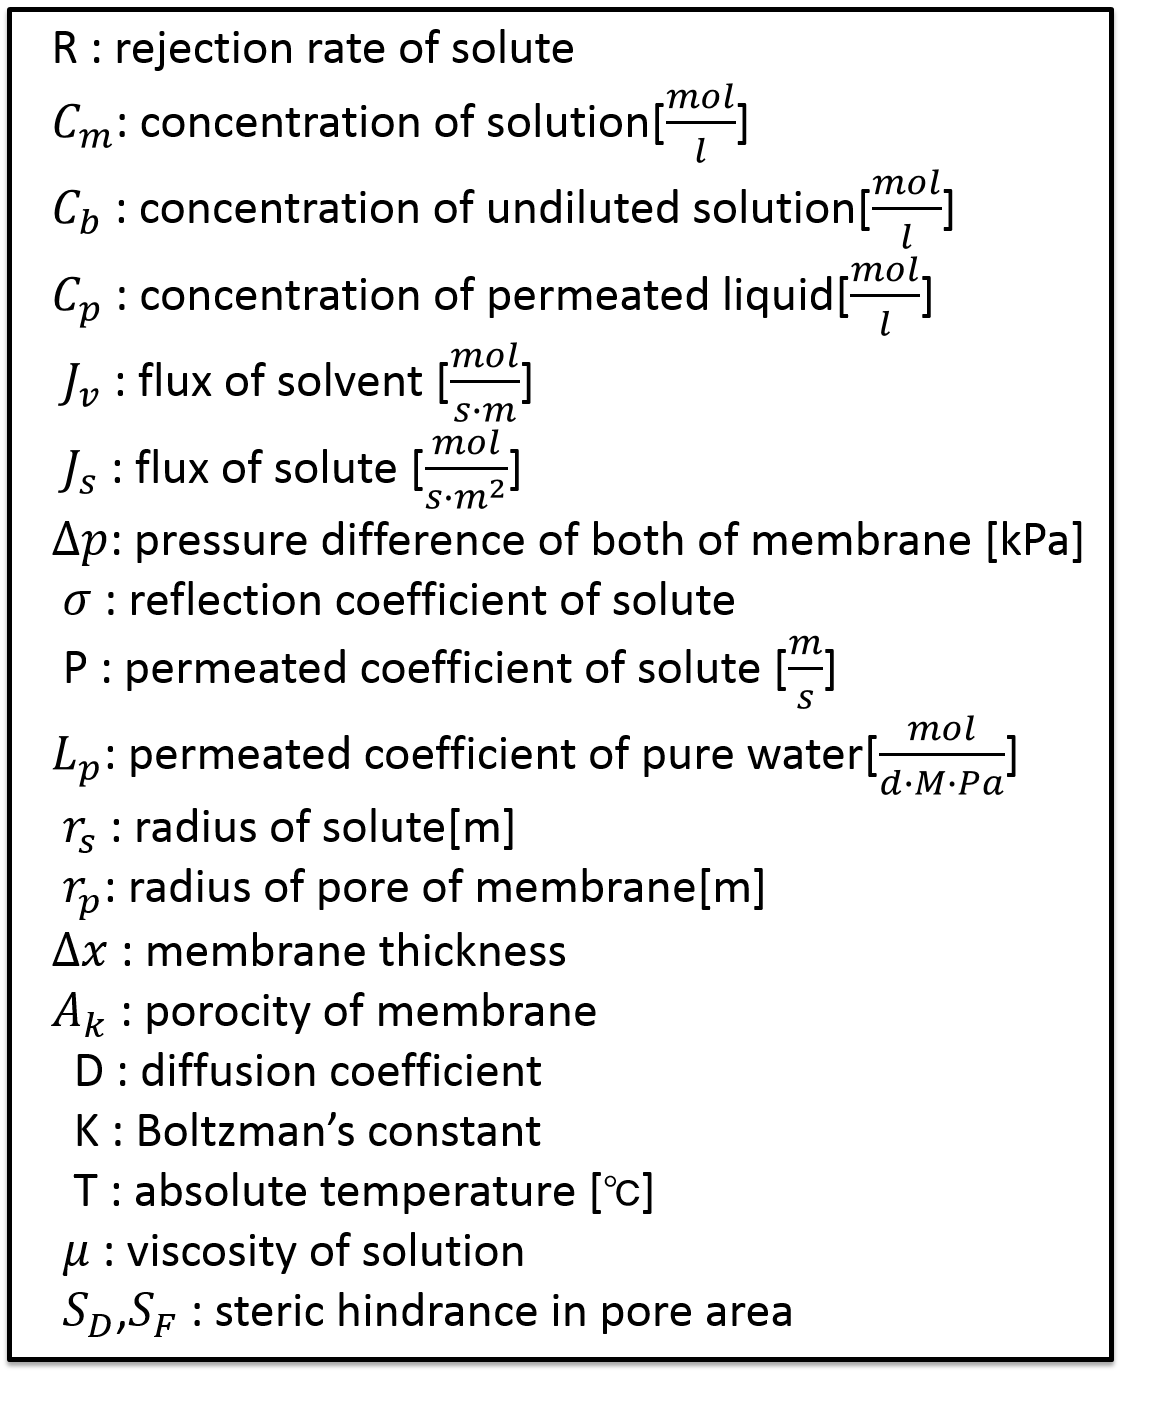
Transmission phenomenon of permeate membranes is characterized by the following equations regarding flux
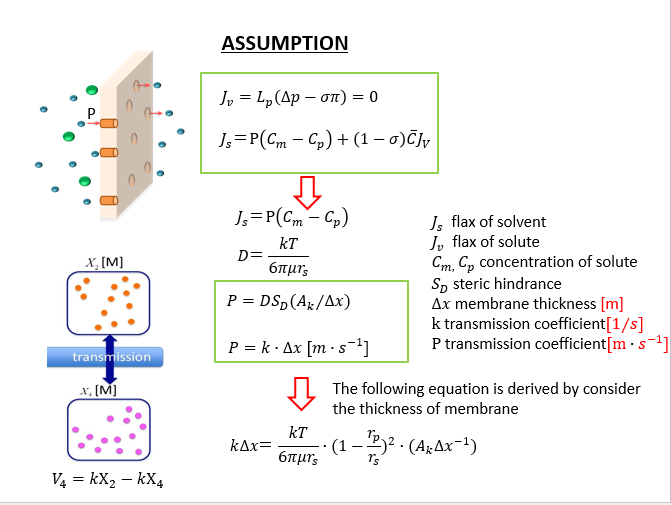
Because no outside pressure is added to the system, we can ignore the volume flux of the solvent (Jv = 0); that is, the membrane permeation is due to the concentration difference between the cross-border rooms. Because the volume flux Jv is described by a transmission rate and the thickness of membrane, we obtain the following master equation for the design.
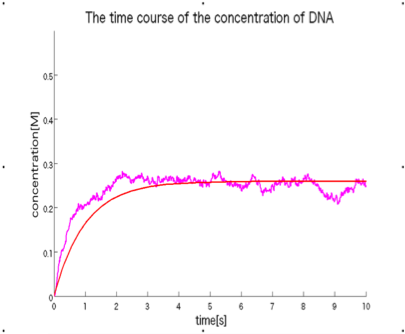
in this section, we will show a validation result for our method by using in-silico experiment. If a time-course data on a concentration change in the system, which is calculated with only a transmission rate k [1/s] based on chemical kinetics (ordinary differential equation-based simulation), coincide with that with only three structural parameters, a size of pore [nm], thickness of the membrane [nm], and a open area ration [-], based on particle simulation (stochastic simulation).
Fig.6 indicates a result on a stochastic particle simulation in which thepermeation phenomenon successfully occurs in-silico . Three structural parameters and transmission coefficient are in the Table. 2. Fig. 7 shows two kinds of time-course curves from the macroscopic ordinary differential equation-based simulation with only a transmission coefficient k and the microscopic stochastic particle simulation with only three structural parameters, indication that they have a similar time-course shape. Therefore, we conclude that our design method is theoretically correct of which validity is supported by in-silico experiments.